Instrument View Settings Panel
Use the Instrument View Settings panel to configure the oscilloscope settings including trigger settings and measurement selection.
Default Setup
Recall the oscilloscope's default setup. This is the same as pressing the front panel [Default Setup] key.
Auto Scale
Automatically configure the oscilloscope to best display the input signals.
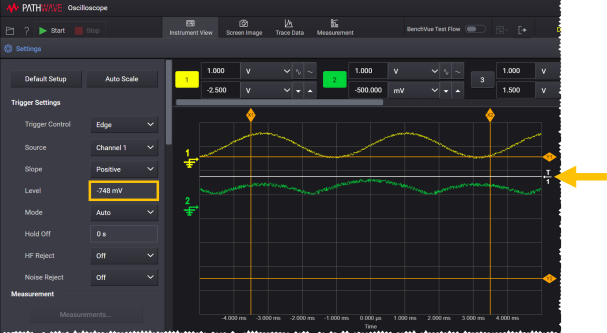
Trigger Settings
Configure the trigger settings including trigger control, trigger source, trigger slope, and trigger level. In addition of inputting the trigger level in the Level field, you can also drag the trigger reference indicator at the right of the trace display to the desired level.
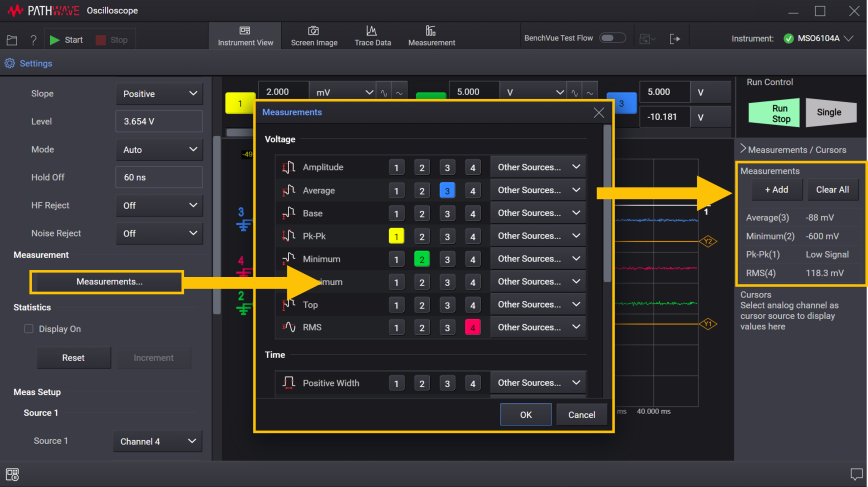
Measurement Settings
You can make automatic measurements on waveforms and display them next to the chart. The number of supported measurements varies by instrument model number and the most-recent selections will take precedence. Click "Clear All" to clear all measurements on all channels.
Statistics
Display the measurement statistics.
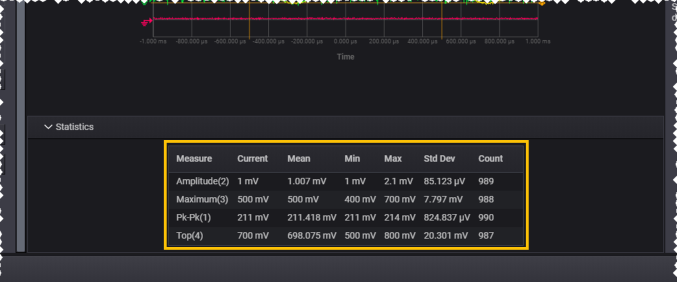
Display On – Select this check box to enable the measurement statistics display located below the chart.
Relative σ (Sigma) – Select this check box to enable a relative standard deviation. When enabled, the standard deviation shown in the measurement statistics becomes the standard deviation/mean.
Reset – Reset all statistics and begin recording statistical data again.
Increment – This button is available only when the acquisition is stopped. Click the "Single" or "Run/Stop" button to stop the acquisition. Click the "Increment" button to add the currently-measured waveform to the collected statistical data.
Sort the statistical data
Click the ^ or v icon right next to each title to sort the data in ascending or descending order.
Hide or show the statistical data table
Click the ^ or v icon in the Statistics title bar to hide or show the statistical data table.
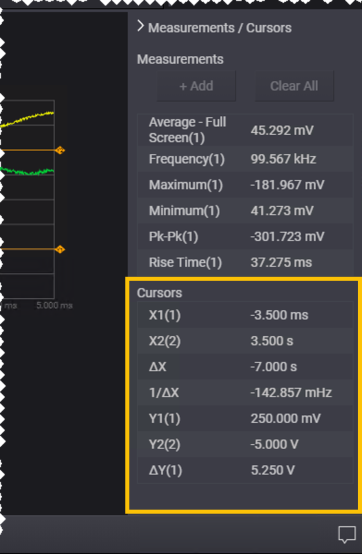
Cursors Settings
Cursors are horizontal and vertical markers that indicate x-axis values and y-axis values on a selected waveform source. You can use cursors to make custom voltage, time, phase, or ratio measurements on oscilloscope signals. Cursor information is displayed next to the chart.
Cursor Mode
Select the desired cursor mode.
Off – Turn off cursor mode.
Manual – In this mode, the ΔX, 1/ΔX, and ΔY values are displayed. ΔX is the difference between the X1 and X2 cursors and ΔY is the difference between the Y1 and Y2 cursors.
Measurement – When measurements are displayed, this mode shows the cursor locations used to make the measurement. When you add a measurement, it becomes the one that cursors are displayed for.
Track Waveform – As you move a cursor horizontally, the vertical amplitude of the waveform is tracked and measured. The time and voltage positions are shown for the markers. The vertical (Y) and horizontal (X) differences between the markers are shown as ΔX and ΔY values.
X Only – In this mode, only X1 and X2 cursors are displayed.
Y Only – In this mode, only Y1 and Y2 cursors are displayed.
Cursor Source
Select the input source for the cursor values.
Cursor Selection
Select the cursor to be adjusted.
WaveGen Option Support
The oscilloscope application includes controls for the optional WaveGen built-in waveform generator available on those Keysight models that support this option. For those supported models, a separate license is required to enable the WaveGen functionality in the oscilloscope. Note that this license is an option for the oscilloscope instrument and it is required to use the WaveGen functionality with the oscilloscope application. For details on whether your oscilloscope supports this option, refer to the oscilloscope's user manual.